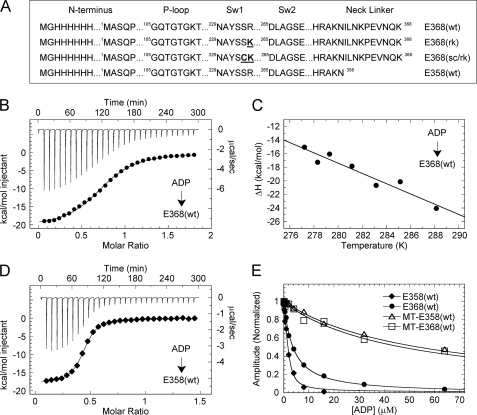
FIGURE 1.
Thermodynamics of ADP binding. A, kinesin-5 constructs used in this study with substitutions highlighted in bold. B, ITC titration of 1.0 mm ADP into 0.13 mm E368(wt) at 10 °C (top) and the peak-integrated heats of reaction versus molar ratio (bottom). The smooth line corresponds to a single-site binding model yielding ΔH = −20.7 kcal mol−1 and Kd = 7.5 μm. C, ΔH versus temperature for ADP binding to E368(wt), yielding ΔCp = −0.755 kcal mol−1 K−1. D, ITC titration of 0.6 mm ADP into 0.094 mm E358(wt) at 10 °C: ΔH = −17.8 kcal mol−1 and Kd = 0.79 μm. E, ADP-dependent competitive inhibition of mantATP binding (as indicated). Final concentrations are: 1 μm kinesin-5, 0 or 1.5 μm MTs, 0 or 6 μm Taxol, 1.5 μm mantATP, 0–128 μm ADP. Ki,ATP = 0.45, 3.44, 53.6, and 48.0 μm, respectively.

