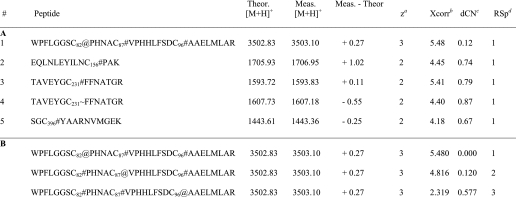
TABLE 3.
Part A, cysteine containing peptides identified from MS/MS spectra with selected SEQUEST parameters shown for each peptide. Part B, Bioworks ShowOut view for peptide #1 in panel A, depicting the next two closest matches to the database. Subscripts denote the position of the cysteine within the 2-KPCC sequence. Symbols represent modifications to cysteine and are as follows: #, iodoacetamide; ∼, acrylamide; and @, BES
a Calculated charge state based on the observed m/z value.
b The Xcorr value is the cross-correlation value from the search, or a measure of how closely an experimental MS/MS spectrum matches to a theoretical MS/MS spectrum for a given peptide in the database.
c Delta Correlation value, dCn indicates how different the first hit is from the second hit in a database search. It is calculated as follows: (Xcorr#1 − Xcorr#2)/Xcorr#1. A general rule of thumb is that a dCn of 0.1 or greater is good.
d Relative Sp score. Sp is the preliminary score. After finding all peptides that match within the selected mass tolerance, SEQUEST dose a preliminary scoring of these candidates to reduce the list down to 500 for the final XScorr analysis. Ideally the RSp value should be 1 on the best matches.

