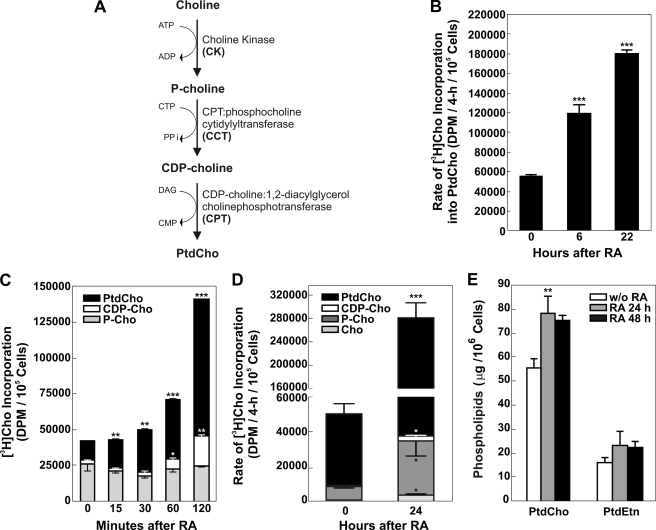
FIGURE 1.
A, schematic representation of CDP-choline Kennedy pathway. DAG, diacylglycerol. B, stimulation of the CDP-choline pathway after RA. Neuro-2a cells were incubated with 20 μm RA for 0–24 h. At the times indicated, cells were radiolabeled with [3H]choline for 4 h, and lipids were extracted, and the radiolabel associated with PtdCho was quantified by scintillation counting. C, cells were radiolabeled with [3H]choline continuously from 0 to 120 min after addition of RA. The distribution of significant amounts of radioactivity among the pathway components was quantified by scintillation counting following lipid extraction of the cells and thin layer chromatography as described under “Experimental Procedures.” Data represent the mean of two determinations ± S.D. D, at times indicated, cells were radiolabeled with [3H]choline for 4 h; lipids were extracted, and the radiolabel associated with choline (Cho), phosphocholine (P-Cho), cytidine diphosphocholine (CDP-Cho), and phosphatidylcholine (PtdCho) was quantified by scintillation counting following thin layer chromatography as described under “Experimental Procedures.” The data represent the mean of four determinations ± S.D. E, cells were incubated with RA for the times indicated, and the amount of PtdCho or PtdEtn was determined following lipid extraction and quantification using the Iatroscan as described under “Experimental Procedures.” The data represent the mean of four determinations ± S.D. Significance was determined comparing untreated cells and treated with RA with the Student's t test: *, p < 0.05; **, p < 0.01; ***, p < 0.001.

