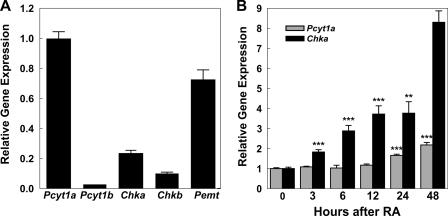
FIGURE 2.
Expression of genes involved in PtdCho biosynthesis. A, RNA was isolated from Neuro-2a cells without treatment, and transcript levels were quantified by real time RT-qPCR using gene-specific primers and probes. Data were normalized to glyceraldehyde dehydrogenase mRNA and expressed relative to Pcyt1a levels. Pcyt1a encodes choline cytidylyltransferase α; Pcyt1b encodes choline cytidylyltransferase β2; Chka encodes choline kinase α; Chkb encodes choline kinase β. Data represent the mean of three determinations ± S.D. B, Neuro-2a cells were incubated with 20 μm RA for the indicated times, and transcript levels were quantified by real time RT-qPCR using gene-specific primers and probes. Data were normalized to glyceraldehyde dehydrogenase mRNA and expressed relative to the levels in untreated cells. Data represent the mean of three determinations ± S.D. Significance was determined comparing untreated cells and treated with RA with the Student's t test: **, p < 0.01; ***, p < 0.001.

