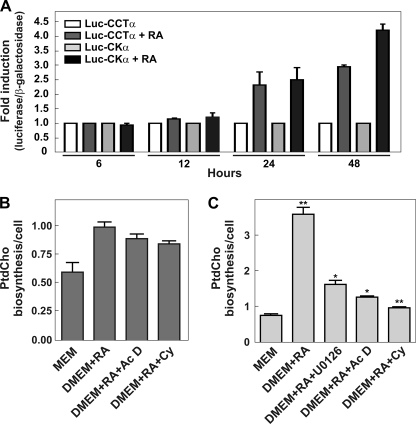
FIGURE 3.
Transcriptional analysis of Pcyt1a and Chka genes during Neuro-2a differentiation. A, Neuro-2a cells were transfected with Luc-CCTα or Luc-CKα proximal promoter reporter constructs together with pSV-β-galactosidase as a transfection control. 24 h after transfection, cells were grown in proliferating media (MEM, 10% FBS) or in differentiating media (DMEM supplemented with 2% FBS) supplemented with 20 μm RA. Luciferase (Luc) and β-galactosidase activities were measured at 6, 12, 24, and 48 h after differentiation was initiated. Graphs represent the ratio between luciferase/β-galactosidase obtained in differentiating versus no-differentiating conditions from three independent experiments. The values are means ± S.E. B and C, Neuro-2a cells were treated with U0126 (10 μm), actinomycin D (Ac D) (0.1 μg/ml), and/or cycloheximide (Cy) (0.1 μm) in presence of RA (20 μm) for 30 min (early stimulation (B)) or 20 h (later stimulation (C)). After that, cell were labeled with 2 μCi/ml [2-14C]acetate during 4 h; samples were collected and lipids analyzed as described previously. Results are expressed as PtdCho biosynthesis/cells, and the graphs are representative of two independent experiments ± S.E. Significance was determined by comparing untreated cells and cell treated with RA with or without inhibitors with the Student's t test: *, p < 0.05; **, p < 0.01.

