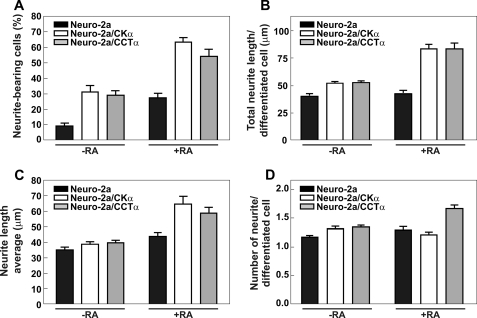
FIGURE 5.
CCTα and CKα overexpression promotes neuritogenesis. Neuro-2a, Neuro-2a/CCTα, or Neuro-2a/CKα cells were grown in the presence or absence of RA (20 μm) for 24 h. A, graph represents the percentage (%) of neurite-bearing cells for each cell line grown in the presence and in the absence of RA. B, graph represents total neurite length (μm) per differentiated cell for each cell line growth in the presence and absence of RA. C, graph represents the average of neurite length (μm) per differentiated cell for each cell line growth in presence and absence of RA. D, graph represents the number of neurites per differentiated cell for each cell line growth in the presence and absence of RA. Graphs are representative of five independent experiments ± S.E.

