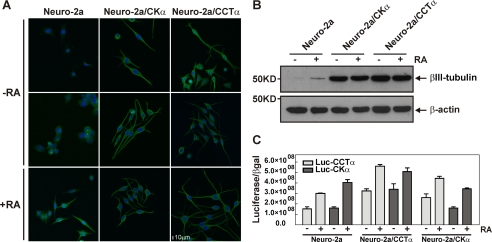
FIGURE 6.
βIII-tubulin expression in cells that trigger differentiation when PtdCho biosynthesis is stimulated. A, detection of βIII-tubulin (green) by immunocytochemistry in Neuro-2a, Neuro-2a/CKα, and Neuro-2a/CCTα cells treated with (+RA) or without (−RA) RA. Images were adjusted for contrast and gamma (60/1.4) using Nikon EZ-C1 3.70 Free Viewer software. Bar, 10 μm. B, Western blot analysis shows the levels of βIII-tubulin in each condition for each cell lines. Samples were collected after RA treatment, and equal amounts of cell lysates (40 μg) were subjected to SDS-PAGE and immunoblotting with anti-βIII-tubulin or anti-β-actin antibodies. Immunoblot is representative of three independent experiments. C, Neuro-2a/CCT α, Neuro-2a/CCTα, and Neuro-2a cell lines were transfected with Luc-CCTα or Luc-CK α proximal promoter reporter constructs together with pSV-β-galactosidase as a transfection control. 24 h after transfection, cells were grown in proliferating media (MEM supplemented with 10% FBS) or in differentiating media (DMEM supplemented with 2% FBS) supplemented with 20 μm RA. Luciferase and β-galactosidase activities were measured at 24 h after differentiation was initiated. Graph represents the ratio between luciferase/β-galactosidase and is representative of two independent experiments each one performed by duplicate.

