FIGURE 6.
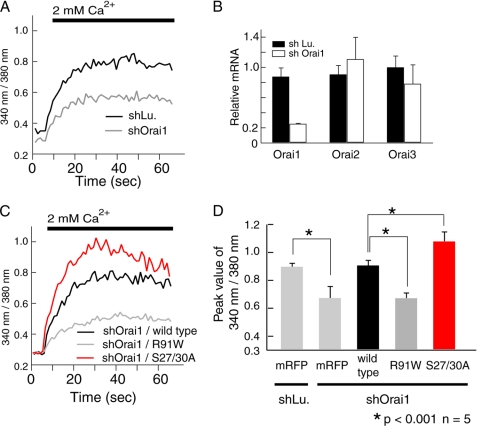
Phosphorylation of Orai1 at S27A/S30A suppresses SOCE. A, SOCE was measured in HEK293 cells transfected with shOrai1 (targeting the 3′-untranslated region of Orai1) and shLu (Lu, luciferase) as negative control. B, knockdown efficiency and specificity were determined by quantitative real-time PCR. Bar graphs show results from three independent experiments as mean ± S.D. C, SOCE was measured in HEK293 cells transfected with shOrai1 and the coding sequences of wild-type Orai1, non-functional Orai1-R91W and Orai1-S27A/S30A (for protein expression levels see supplemental Fig. S2). D, averages of peak Fura2 ratio values obtained from five independent experiments similar to those in A and C are shown as means ± S.D.

