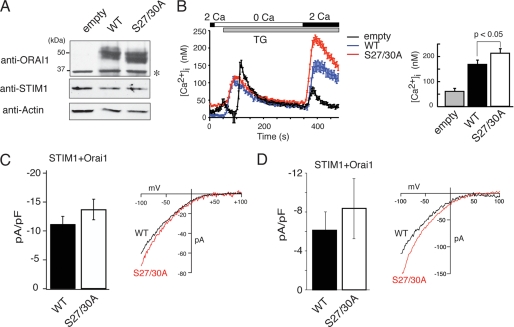
FIGURE 7.
Phosphorylation of Orai1 on Ser-27 and Ser-30 inhibits SOCE and CRAC channel current (ICRAC). A and B, wild-type Orai1 or mutant Orai1-S27A/S30A were expressed in SOCE-deficient fibroblasts from a patient with Orai1-R91W mutation by lentiviral transduction. A, equal expression of transduced wild-type and mutant Orai1 was verified by Western blotting using an anti-Orai1 antibody. Note that endogenous Orai1 levels are too low for detection; *, nonspecific band. B, Ca2+ measurements were conducted in transduced fibroblasts loaded with Fura-2. Cells were stimulated with thapsigargin (TG) in the absence of Ca2+ followed by addition of 2 mm Ca2+ to induce SOCE. Traces represent averages of Ca2+ responses in >30 GFP+ cells analyzed per experiment. GFP expression was from an IRES-GFP cassette in the lentiviral expression vector. Bar graphs show the averages of peak [Ca2+]i obtained from 6–8 independent experiments (empty vector, n = 6; WT, n = 8; S27A/S30A, n = 8). Error bars represent ±S.E. C and D, for measurements of ICRAC, HEK293 cells were transfected with Cherry-STIM1 and either wild-type Orai1 or Orai1-S27A/S30A vectors expressing GFP from an IRES site. Cherry+/GFP+ cells were selected for whole cell recordings. C, cells were stimulated with thapsigargin (1 μm) in 10 mm Ca2+. Shown are averages of current amplitudes at −80 mV measured 100 s after break-in. Orai1-WT (n = 10), Orai1-S27A/S30A (n = 7); error bars represent ±S.E. D, cells were stimulated with 20 μm IP3 in the patch pipette to deplete ER Ca2+ stores. Shown are current amplitudes at −80 mV measured 50 s after break-in. Orai1-WT (n = 6), Orai1-S27A/S30A (n = 6); error bars represent ±S.E. Representative current-voltage (I-V) relationships of Ca2+ currents recorded immediately (C) and 50 s (D) after break-in, respectively, are shown on the right.

