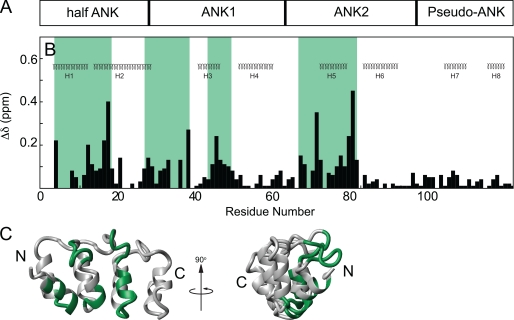
FIGURE 5.
Chemical shift map of CP binding on V-1. The domain arrangement of V-1 is shown (A) aligned on top the secondary structures of V-1, corresponding to the NMR structure (37) (B). Chemical shift changes were plotted against residue number for V-1. Regions affected by binding are highlighted green. Chemical shift changes in V-1 were plotted onto the ribbon diagram of V-1 (C) and its N and C termini are indicated.

