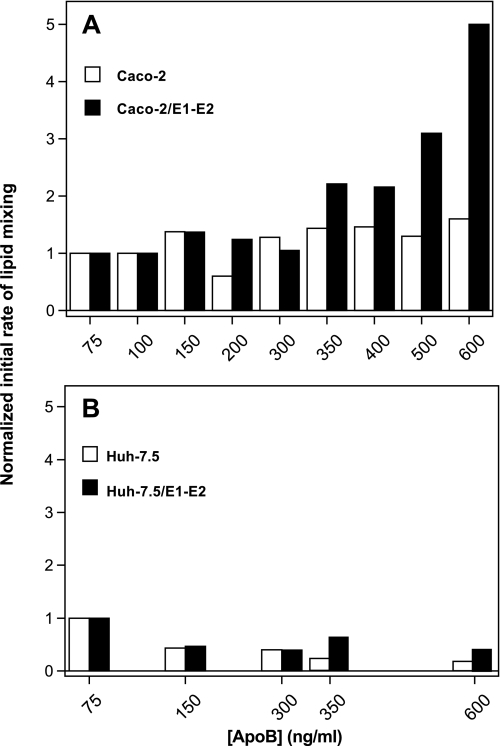
FIGURE 2.
Dose-dependent lipid mixing of eLVP produced from Caco-2 cells (A) or Huh-7.5 cells (B). TRL particles from untransduced (open bars) or E1-E2-transduced cells (solid bars) were added at indicated apoB100 concentrations to a cuvette containing phosphatidylcholine:cholesterol:R18 liposomes (see “Materials and Methods”), and lipid mixing was recorded at pH 5.0 over a 10-min period. Initial rates of lipid mixing were calculated from the tangent at the steepest part of the fusion curves and results normalized, with 1 representing the basal lipid mixing rate measured for the lowest concentration of apoB tested (75 ng/ml).

