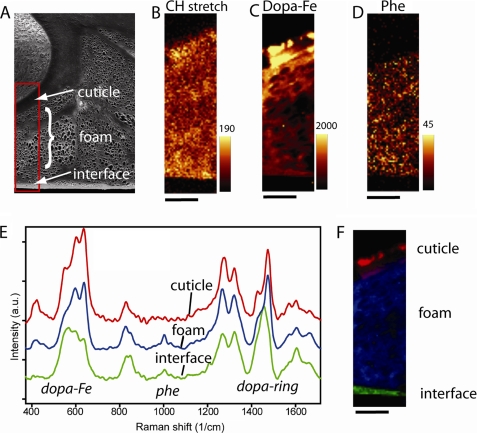
FIGURE 10.
Imaging of a byssal adhesive plaque section. A, scanning electron micrograph of a sectioned byssal plaque from M. galloprovincialis. The boxed region was subjected to Raman microscopy. Raman images of the same region were integrated for CH-stretching (2850–3010 cm−1) (B), iron-DOPA (490–696 cm−1) (C), and phenylalanine (980–1020 cm−1) (D), respectively. E, average spectra of the three morphologically distinct domains in the plaque i.e. cuticle, core, and plaque-substrate interface. F, the distribution of these spectra is visualized through least square fitting. Scale bar below Raman images is 10 μm.

