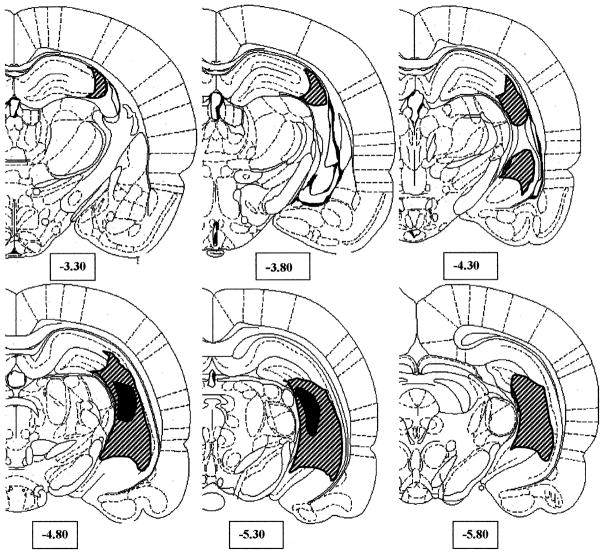
Figure 2.
Hemi-coronal representations showing the extent of neonatal ibotenic acid-induced lesions. Striped areas represent largest extent of the lesion (on either side) in the bilaterally lesioned group, while the black areas represent the smallest lesion area. The majority of lesioned rats had lesion sizes closer to the large extreme. Numbers below the sections indicate distance of sections posterior to bregma based on stereo-taxic coordinates of Paxinos and Watson.

