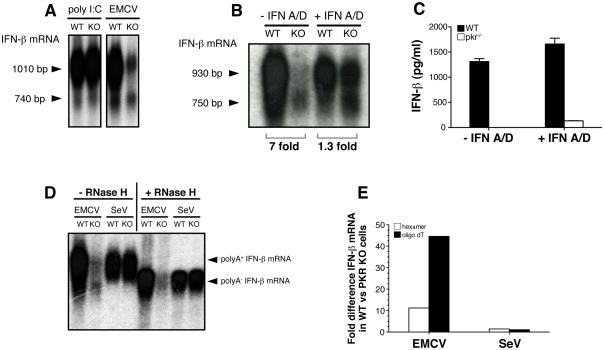
Fig. 5. Deadenylated IFN-β mRNA in EMCV-infected PKR−/− cells.
(A, B, C) BM-DCs (5×10⁵/well) were transfected with poly I:C (10μg/well) for six hours or infected with EMCV (MOI=10) for 9 hours in the absence or presence of IFN A/D (1000U/ml) as indicated. (A, B) IFN-β mRNA was analyzed by Northern blot and the position of two distinct species of IFN-β mRNA is indicated by arrow heads. The size of the different mRNA species was calculated by comparing their electrophoretic mobility to a molecular size marker in the form of a ssRNA ladder. Numbers below picture represent fold difference between samples from PKR+/+ and PKR−/− cells as determined by phosphoimager analysis. (C) IFN-β protein in the supernatant from the same cultures as in (B) was measured by ELISA. Data are the mean ± SD of triplicate wells and are representative of three independent experiments with similar results. (D) Detection of polyA+ and polyA− forms of IFN-β mRNA by Northern blot. Total RNA was isolated from BM-DCs infected with EMCV (MOI=10) or SeV (MOI=1) for 12 and 6 hours respectively. Where indicated, RNA samples were treated with oligo-dT ± RNase H. Arrow heads indicate position of polyA+ and polyA− IFN-β mRNA. (E) RNA from cells treated as in (D) was analyzed by quantitative PCR using random hexamer (open bars) or oligo dT oligonucleotides (filled bars) to generate cDNA. Relative expression of IFN-β mRNA in PKR+/+ versus PKR−/− cells was calculated by analysing the Ct values for each amplification curve and converting them into fold difference using the formula 2(−ΔCt). Data in (D) and (E) are representative of two experiments.

