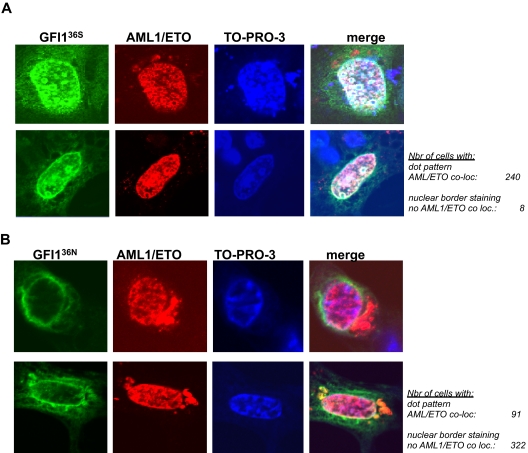
Figure 5.
AML1/ETO colocalizes with GFI136S but not with the variant GFI136N. (A) NIH 3T3 cells were transfected with expression vectors for AML1/ETO and GFI136S (original magnification ×100). (B) NIH 3T3 cells were transfected with expression vectors for AML1/ETO and the GFI136N variant form. Expression of GFI1 proteins was revealed by immune-fluorescence with an α-GFI1 antibody and a secondary FITC labeled antibody. The presence of AML1/ETO was revealed by staining with the α-ETO antibody and a secondary rhodamine-labeled antibody. Nuclei were visualized by treatment with the DNA dye TO-PRO-3 (blue). The staining for each protein and DNA is represented in a separate column. Examples of 2 different cells are given for each setting in 2 different rows. The merging of all 3 fluorescence signals is depicted in the last column at the right side and results in a white staining, which can be detected when the signals corresponding to the GFI136S protein and AML1/ETO are merged. White areas or white spots in the nuclei of transfected cells suggest a colocalization of AML1/ETO and the GFI136S protein (A). In contrast, no such white areas can be detected between GFI136N and AML1/ETO (B). The green signal representing the GFI136N protein remained at the nuclear/cytoplasmic border, well separated from the red signal in the nucleus that represents AML1/ETO (B), clearly indicating a lack of colocalization between both. The number of cells analyzed for the subnuclear localization and a colocalization with AML1/ETO are indicated (original magnification ×100).

