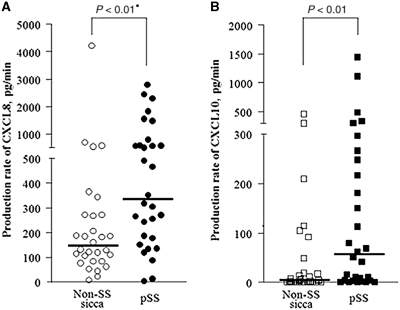
Fig. 2.
Salivary production rates of CXCL8 (A) and CXCL10 (B) in pSS and non-SS sicca patients, when saliva secretion was stimulated. The production rate was calculated by multiplying salivary flow rates by chemokine concentrations. Bars mean the median values. *P-value calculated by the Mann–Whitney test.

