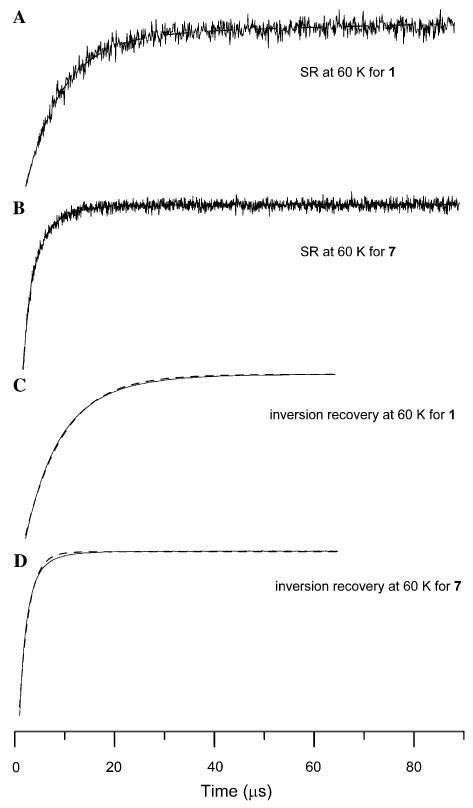
Fig. 1.

Recovery curves at 60 K for 2.5 mM 1 and 7 in 2:1 toluene/chloroform solution, obtained by (A) saturation recovery at g = 2.05 using 10900 scans and 900 points, (B) saturation recovery at g = 2.09 using 98100 scans and 1977 points, (C) inversion recovery at g = 2.05 using 200 scans and 256 points, (D) inversion recovery at g = 2.09 using 300 scans and 256 points. (A, B) Dashed lines are fits calculated for a distribution of relaxation rates. The y-axes of the plots are EPR signal amplitude in arbitrary units. (C, D) Dashed lines are fits calculated for a single exponential. For the inversion recovery curves the fit lines obtained for a distribution of exponentials were indistinguishable from the experimental data.
