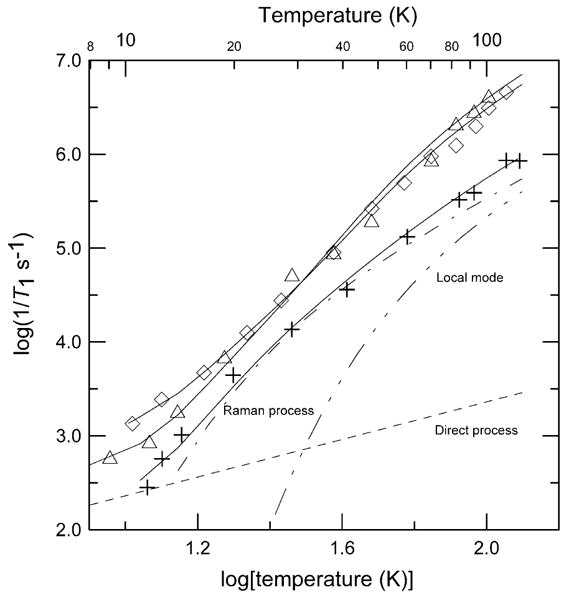
Fig. 3.

Temperature dependence of X-band spin–lattice relaxation rates for the perpendicular lines in the spectra of 1 (+), 7 (△), and 8 (◊) in 2:1 toluene/chloroform solution. The solid lines through the data are fits obtained using Eq. (2) and the parameters in Table 2. The contributions to the relaxation for 1 from the direct process (---), Raman process ( ) and local mode (
 ) are shown separately.
