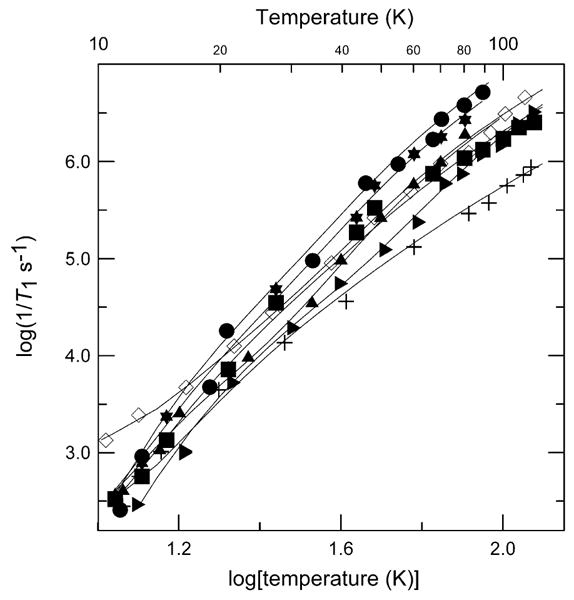
Fig. 5.

Temperature dependence of X-band spin–lattice relaxation rates for the perpendicular lines in the spectra of 1 (+), and 8 (◊) in 2:1 toluene/chloroform solution; CuEDTA (✶), and Cu(aq)2+ (●) in water/glycerol (1:1); Cu(OH)42− in 3 M NaOH solution (■); CuIm4 (▲), and CuMeIm4 (▶) in 1:1 water/ethylene glycol. The solid lines through the data are fits obtained using Eq. (2) and the parameters in Table 2.
