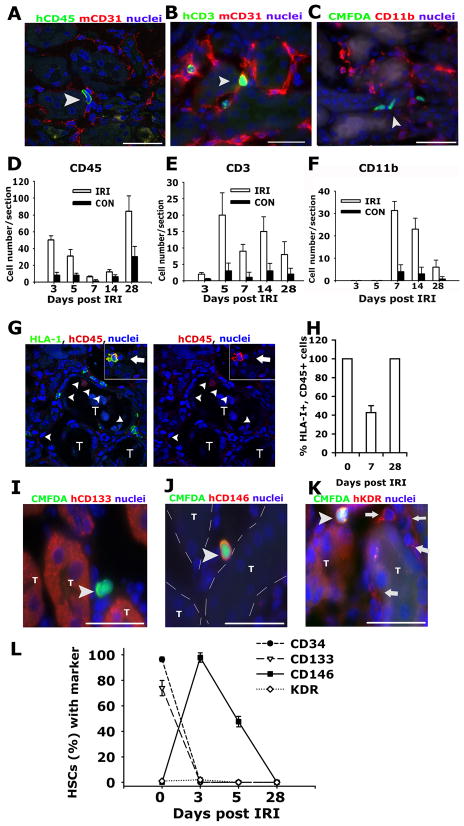
Figure 4.
Differentiation of human HSPCs in kidneys. Representative confocal image (A) and epifuorescence images (B–C) of kidney outer medulla showing expression of human CD45 (A), human CD3 (B), and absence of CD11b (C) in cells (arrowheads) in d5 post IRI kidneys that received IV injection of HSPCs 1 day following injury. Images are co-labeled (A–B) to show mCD31 (red) of the mouse vasculature. Graphs showing the number of human CD45+ (D), human CD3+ (E), and CD11b+; CMFDA+ (F) cells identified in post IRI kidneys and control kidneys. (G–H) Confocal split panel image (G) and graph (H) showing the presence of HLA-I+, hCD45− cells (arrowheads) in the interstitium of the d7 post IRI kidney [T = tubule]. Inset shows a HLA-I+, hCD45+ leukocyte (arrow). (I–K) Representative epifluorescence images of the outer medulla of day 3 post IRI kidney of NOD/SCID mice that received human HSPCs on d1–d2 labeled with CMFDA (arrowheads) co-labeled with antibodies against human CD133 (I), CD146 (J) and KDR (K). Note anti-KDR antibodies also detected mouse endothelium (arrows) [T = tubule, outlined with hatched white line in J]. (L) Graph showing the expression of stem cell/CEP markers by HSPCs prior to (d0) and following recruitment to the post IRI kidney. (Bars = 50μm). Data are mean ± SD. n = 6/timepoint.

