
Figure 3.

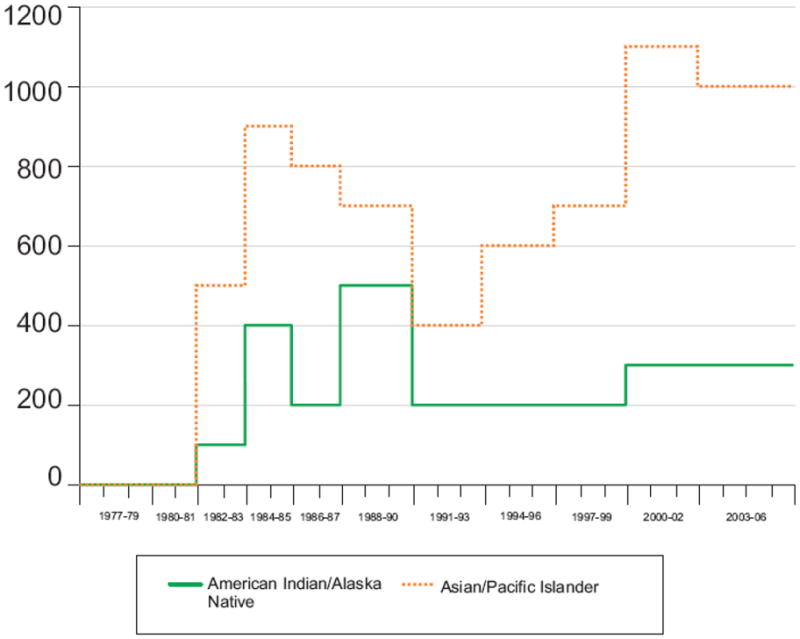
Estimated number of new HIV infections, by race/ethnicity (a. all race/ethnicity categories and b. Asian/Pacific Islander and American Indian/Alaska Native), extended back-calculation model, 50 U.S. states and the District of Columbia , 1977–2006
Extended back-calculation approach.
Tick marks denote beginning and ending of a year.
The model specified time periods within which the number of HIV infections were assumed to be approximately constant.