
Fig. 5.
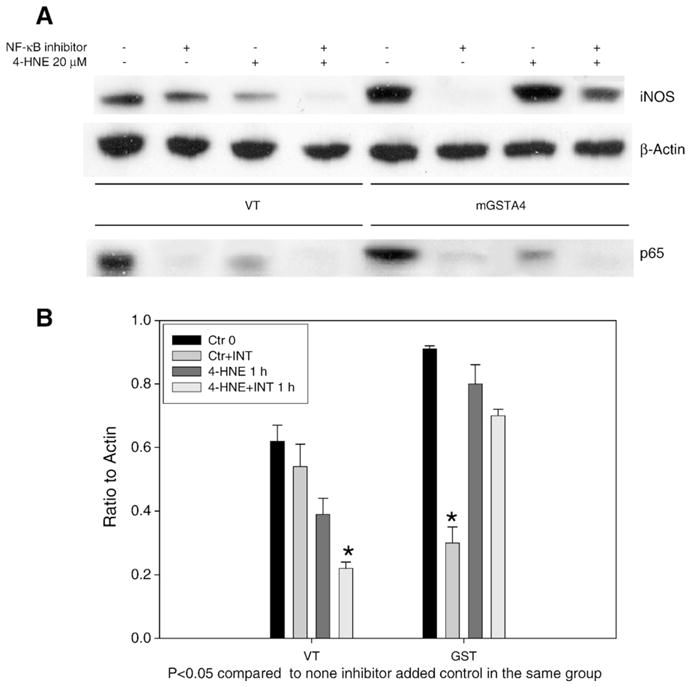
Effects of NF-κB inhibitor on iNOS and p65 expression. Panel A: Western blot of iNOS and p65 expression in presence of NF-κB inhibitor. VT/mGSTA4-transfected MS1 cells were grown in 100 mm dishes. Cells were treated with NF-κB inhibitor for 3 h, and then 20 μM 4-HNE for 1 h. Symbols (−/+) indicate minus or plus 4-HNE or NF-κB inhibitor (50 μg/ml). Cytoplasmic and nuclear protein were extracted as described in section 2 and loaded into SDS-PAGE for iNOS and p65 expression, respectively. Primary antibodies of rabbit anti-iNOS were diluted at 1:100, primary mouse monoclonal anti-p65 antibodies were used at 1:200. Panel B: The quantification of the Western blots of iNOS. Ratios of iNOS band density to β-actin as control are shown. Experiments were repeated three times, data shown in panel B represents the mean±SE of triplicate samples. Asterisk indicates p <0.05 when compared to matched cells without inhibitor treatment.