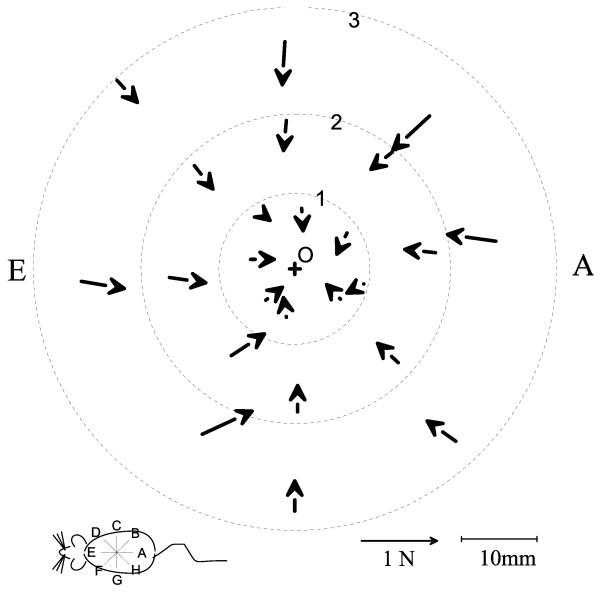
Figure 5.
The maximum active interaction force vectors between the rat and the robot (see also figure 2 and 4). Data from a normal rat, J494, in which the initial pre-perturbation interaction of the phantom and the rat was low on each set of trials. (+: location of robot equilibrium before perturbations, O: approximate rest location of rat before perturbations). The vectors show the peak forces generated by the rat after subtraction of resting forces. The vectors displayed were measured at the peak excursion produced by the Phantom for each perturbation. Each ring of vectors represents a perturbation size (1: 19mm, 2: 38mm, 3: 57mm ). Each line of 3 vectors represents a perturbation direction. The interaction forces are shown plotted as vectors at the measurement point to which the robot moved against the rat’s resistance. Force rises with the size of the perturbation, though not proportionately. Note also that forces converge approximately toward the rest position of the rat, but not precisely, since these represent active response forces.

