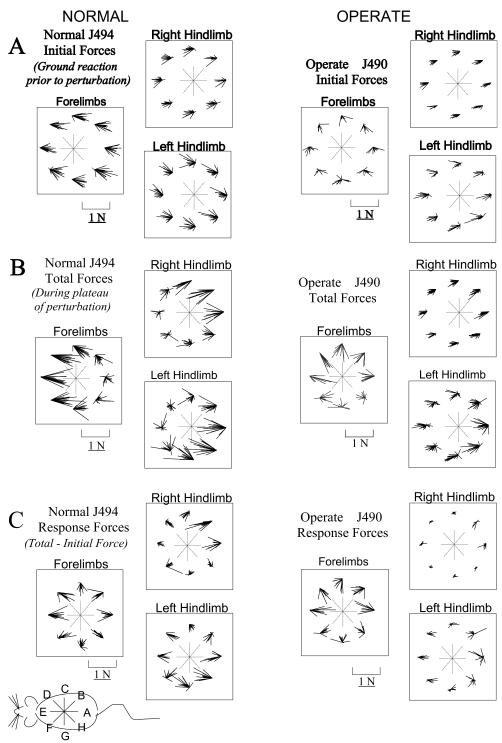
Figure 6.
Plots of raw A. Initial (pre-perturbation), B. Total (peak perturbation, see figure 3), and C. Response (Total-Initial) horizontal plane components of ground reaction force vectors measured from the force-plates. Groups of vectors are shown for the combined forelimbs force-plate and for each hindlimb forceplate. Within each group the measurements are organized into 8 clusters based on the direction of perturbation, as indicated by the central compass. Vectors originate at a common fixed point with no physical significance besides indicating direction of perturbation in the cluster trials. The small schematic of the rat in the lower left corner provides the orientation of the rat and the perturbations. Initial forces in A represent the horizontal plane shear forces before any perturbation. Total forces in B represent the peak interaction of rat and robot. Response forces in C represent the vector difference of forces in B and A. In A: Note variation of force trial to trial, but the clearly differing patterns of forelimb force in the operate and normal. In B: Note the tendency for horizontal shear loading to be concentrated in either the forelimbs (left clusters (perturbation directtions D, E, F in Figure 1) on forelimb plate) or hindlimbs (rightmost clusters (perturbation directtions B, A, H in Figure 1) on hindlimb plates) in the normal rat. Forces in the forelimbs of operate rats differ in direction, and this concentration of loading in either forelimb or hindlimb is largely absent. In C: Note that Hindlimb response forces in the operate are far smaller than in normals (Significantly so, two tailed t-test, p<0.05). In this data set there is some response in the left hindlimb in the operate.

