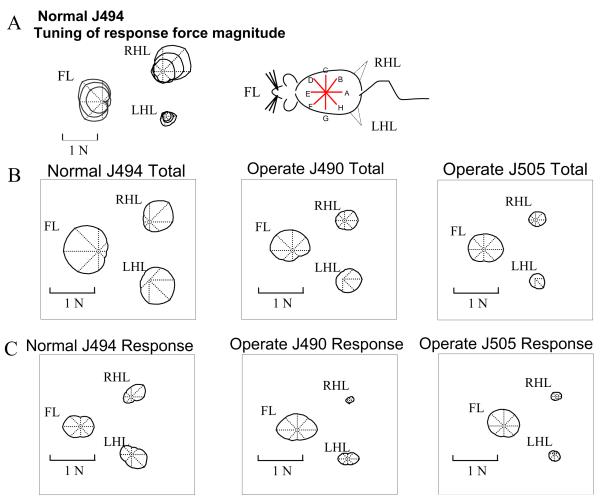
Figure 8.
Polar plots of tuning curves of the magnitude of the horizontal forces for different directions of perturbations. The polar plots are centered on the compass center. A: The tuning curves of the three different size perturbations for a single experiment in a normal rat. Tuning did not differ among perturbation sizes. B: The averages of the total force curves of the three different size perturbations for all experiments in a normal rat and in two operate rats. Note the greater directional tuning in the hindlimbs of normal rats as indicated by greater departure from a centered shape. C: The averages of the response force curves of the three different size perturbations for all trials in the normal and the two operate rats depicted in 5B. Normal rat forelimb and hindlimb responses are strongly tuned. In operate rats the hindlimbs show much less directional tuning and have very small hindlimb forces.

