Figure 9.
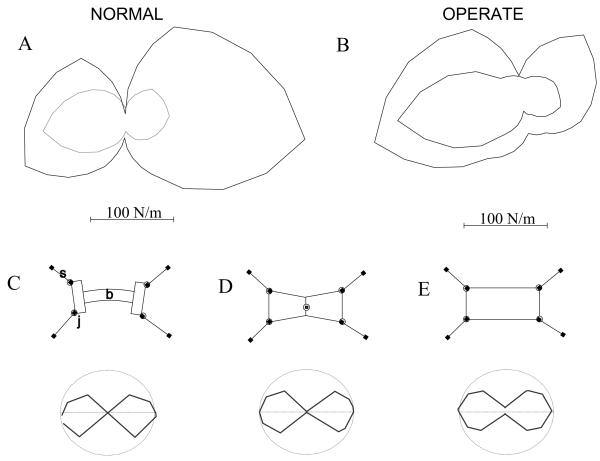
A. A polar plot of the magnitude of stiffness of a normal rat J494. Stiffness magnitude is plotted at each direction of each perturbation. This should be distinguished from a linear fit stiffness ellipse, or a full non-linear fit. Our data did not support linear fits and was not sufficiently complete for a full non-linear fit. The inner curve represents the stiffness magnitude during the largest perturbations; the outer curve represents stiffness during the smallest perturbations. Rats exhibited less stiffness to larger perturbation. The polar plot of the magnitude of stiffness had an hourglass shape. The rat was much less stiff laterally. B. Stiffness plot for an operate rat J490. The stiffness of this rat showed rostrocaudal asymmetry as well as non-linearity, with lower stiffness in caudal directions. Nonlinear aspects of stiffness were at least partly attributable to the quadrupedal structure. To show this we tested 3 simple models of horizontal plane quadrupedal stiffness (C-E). Each showed an hourglass pattern magnitude response similar to the biological data. C Stiffness magnitude plot measured as in A and B for a structural model of a rat comprised of compression spring struts, springy rotary hip and shoulders and a stiff but flexible beam to represent the torso. D Stiffness magnitude in a model of rat comprised of legs as in C and a single central compliant trunk joint. This model could show symmetry breaking by flexure at the trunk joint leading to apparent lateral asymmetry of stiffness as sometimes also seen in the rats. E Stiffness of a structural model of a rat with legs as in C and D but using a rigid box as torso. Note persistence of hourglass shaped lateral stiffness, though less prominent compared to C and D.

