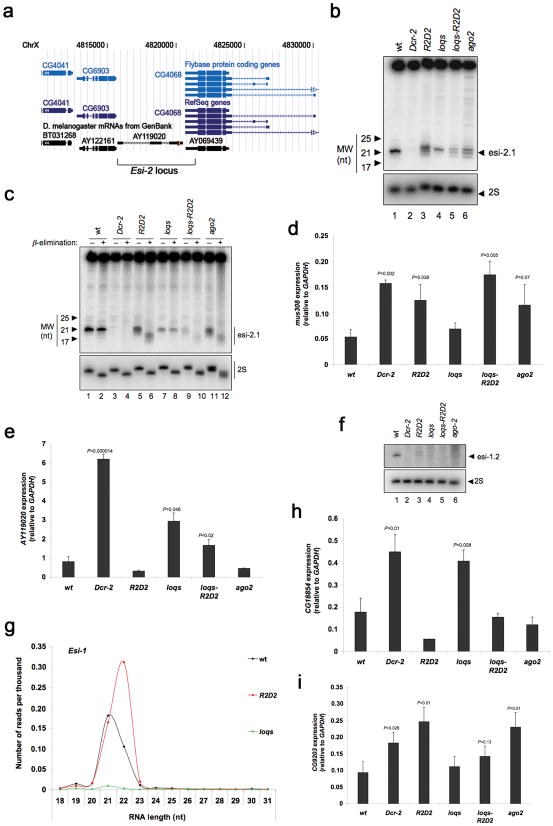
Figure 3. R2D2 and Loqs are required in the endogenous siRNA pathway.
(a) Graphic representation of the genomic region corresponding to the esi-2 locus on the X chromosome, provided by the UCSC Genome Browser. (b) Levels of esi-2.1 RNA as determined by Northern blotting of small RNA fractions from whole males. 2S rRNA blotting was used as a loading control. (c) Sensitivity of esi-2.1 RNA to β-elimination reactions was visualized by Northern blotting of small RNA fractions. 2S rRNA blotting was used to control for loading and elimination. (d,e) mus308 (d) and AY119020 (e) transcript levels as determined by RT-qPCR of total RNA from testes. The graphs display the mean and standard deviation (n=3). (f) Levels of esi-1.2 RNA as determined by Northern blotting of RNA extracted from whole males. 2S rRNA blotting was used as a loading control. (g) Size distribution and normalized number of sequenced RNAs mapping to the esi-1 locus. (h, i) CG18854 (h) and CG9203 (i) transcript levels as determined by RT-qPCR of total RNA from testes. The graphs display the mean and standard deviation (n=3). Statistically significant differences are indicated (Student t test compared to wildtype).

