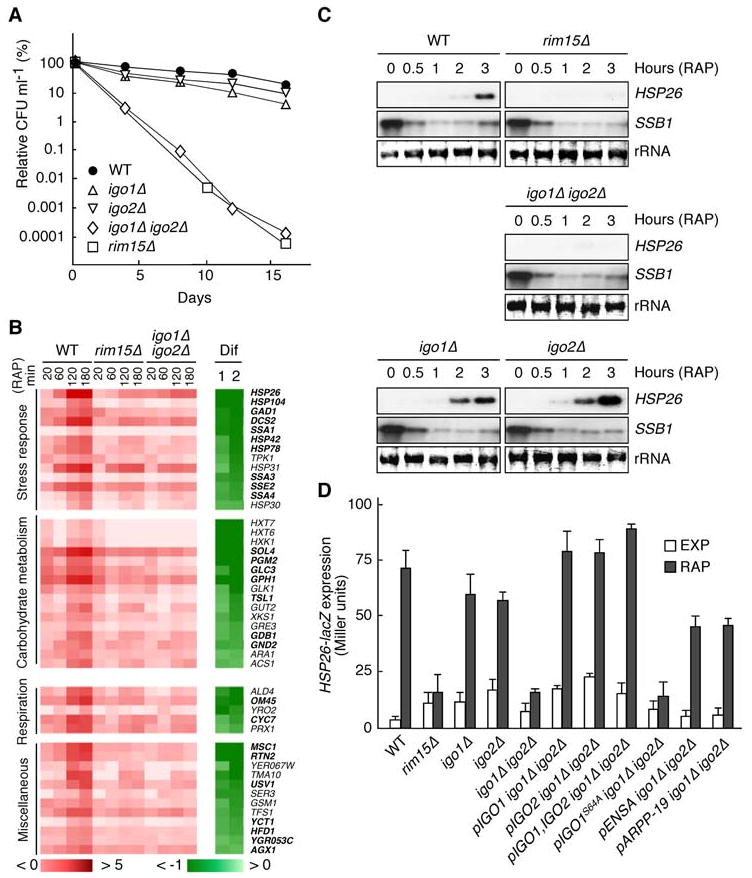
Figure 2. Igo1 and Igo2, Like Rim15, are Required for TORC1 to Properly Control Gene Expression and Chronological Life Span.

(A) Igo1 and Igo2 are redundant, key determinants of CLS. Survival data (CFU ml-1) are expressed as relative values compared to the values at day 0 (which corresponds to day 4 in early stationary phase cultures). Each data point represents the mean of three samples.
(B) Rim15 and Igo1/2 play a largely overlapping role in mediating the rapamycin-induced expression of a defined set of genes. Wild-type (WT), rim15Δ, and igo1Δ igo2Δ cells were treated with rapamycin (0.2 μg ml-1) for the times indicated and compared by microarray analyses. Genes showing (in wild-type cells) at least a 2.8-fold increase (log2 ratio > 1.5) in expression following rapamycin treatment (180 min) were classified as rapamycin-induced genes and sorted according to the maximal Igo1/2 dependence of their response (Dif 1 = log2 [igo1Δ igo2Δ180/igo1Δ igo2Δ0] - log2 [WT180/WT0]; Dif 2 = log2 [rim15Δ180/rim15Δ0] - log2 [WT180/WT0]). Color codes show the log2 of the expression change relative to untreated cells (red-white) and the corresponding Dif value (green-white). Rim15- and Igo1/2-dependent genes that were (using the same criteria as above) also retrieved in global transcription analyses in glucose-limited (diauxic and postdiauxic) cells are indicated in bold face letters. Northern blot analyses of selected genes confirmed our microarray data (not shown).
(C) Rapamycin-induced expression of HSP26 mRNA depends on Rim15 and Igo1/2. Northern analyses of HSP26 and SSB1 mRNAs were done with exponentially growing WT, rim15Δ, igo1Δ, igo2Δ, and igo1Δ igo2Δ cells prior to and following treatment with rapamycin (0.2 μg ml-1) for the times indicated. All samples were run on the same gel (identical film exposure time). The decrease in SSB1 transcript levels was used as internal control for rapamycin function.
(D) Both rim15Δ and igo1Δ igo2Δ mutants are defective in HSP26-lacZ expression. β-galactosidase activities (expressed in Miller units) were measured to monitor the expression of an HSP26-lacZ fusion gene in exponentially growing cells prior to (EXP) or following rapamycin treatment (RAP; 0.2 μg ml-1; 6 hr). Data are reported as averages (n = 3), with standard deviations (SDs) indicated by the lines above each bar. Relevant genotypes are indicated.
