
Figure 5. The 5′-3′ mRNA Decay Pathway Targets HSP26 mRNAs in igo1Δ igo2Δ Mutants.
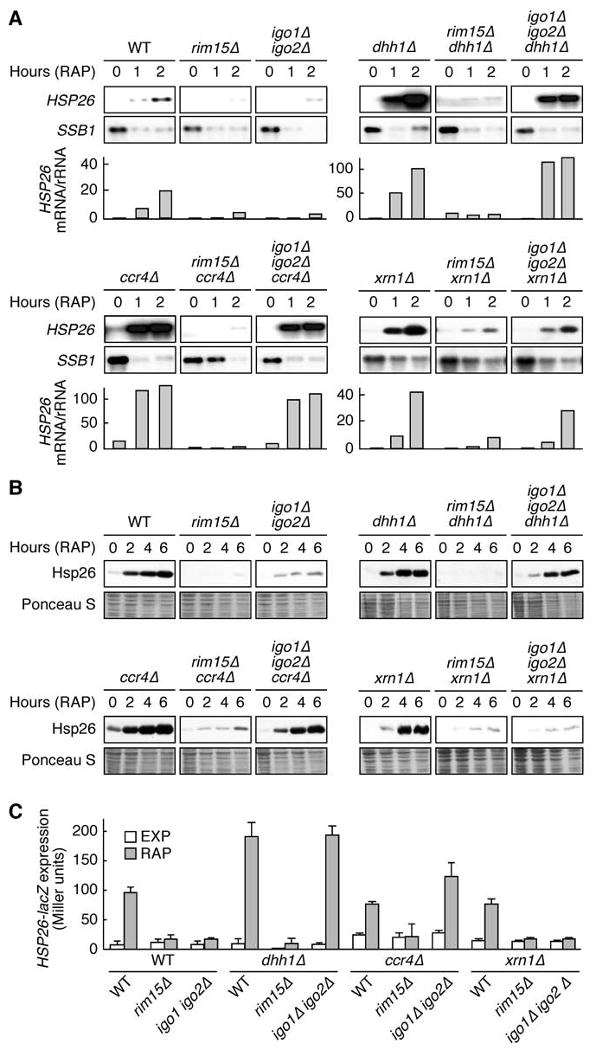
(A) Loss of Dhh1, Ccr4, or Xrn1 suppresses the defect of igo1Δ igo2Δ, but not that of rim15Δ cells, in rapamycin-induced HSP26 mRNA expression. Northern analyses of HSP26 and of rapamycin-repressible SSB1 were done with wild-type and indicated mutant strains prior to (0) and following a rapamycin treatment (RAP; 0.2 μg ml-1) of 1 hr or 2 hr. Bar graphs show the relative level of HSP26 mRNA per rRNA (quantified by PhosphorImager analysis and arbitrarily set to 1.0 for exponentially growing wild-type cells). All samples were run on the same gel (identical film exposure time). Similar results were obtained for other genes (e.g., SOL4 and DCS2; Figure S3A).
(B, C) Loss of Dhh1 or Ccr4, but not loss of Xrn1, suppresses the defect of igo1Δ igo2 in rapamycin-induced Hsp26 protein expression. (B) Cell extracts from the same strains as in (A), treated (2 hr, 4 hr, and 6 hr) or not (0 hr) with rapamycin, were analyzed by SDS-PAGE and immunoblots were probed with specific anti-Hsp26 antibodies. Ponceau S staining of the membranes prior to Immunoblot analysis served as loading control. (C) HSP26-lacZ expression was monitored (as in Figure 2D) in exponentially growing cells prior to (EXP) and following a 6-hr rapamycin treatment (RAP). Data are reported as averages (n = 3), with SDs indicated by the lines above each bar. Strains were as in (A). Please see Figure S3B for northern blot analyses.