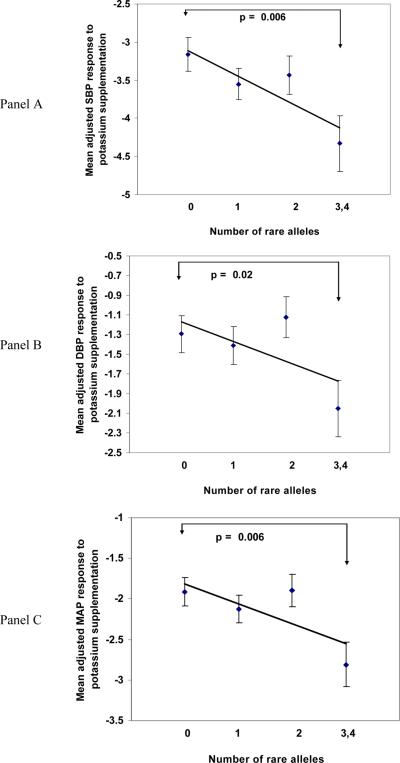
Figure 2.
Cumulative effects of the minor alleles for EDN1 SNPs that showed significant associations with BP response to potassium supplementation. Mean values of adjusted BP response for groups carrying 0, 1, 2, and 3 or 4 rare alleles (545, 596, 448, and 218 individuals, respectively) are shown for SBP (Panel A), DBP (Panel B), and MAP (Panel C). The best fitting trend line and p value from t-tests between those with 0 risk allele and those with 3 or 4 risk alleles are shown (R2 =0.76 for SBP, R2=0.40 for DBP, and R2=0.54 for MAP). BP response variables were adjusted for age, age2, age3, gender, generation, BP examination room temperature, and field center.

