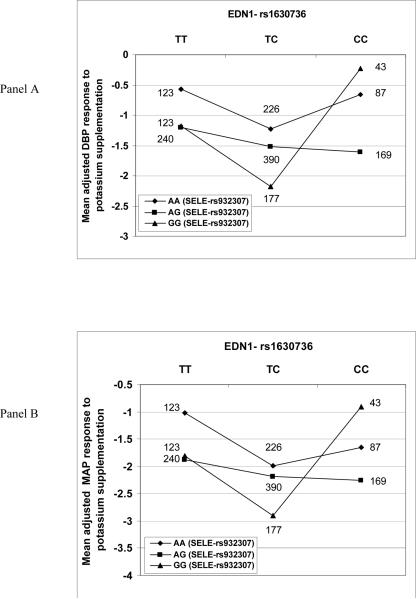
Figure 3.
Mean adjusted values (mm Hg) for DBP response (Panel A) and MAP response (Panel B) to potassium supplementation as a function of interaction between genotypes for EDN1 rs1630736 and SELE rs932307. Number of individuals for each EDN1/SELE genotype group are shown. BP response variables were adjusted for age, age2, age3, gender, generation, BP examination room temperature, and field center.

