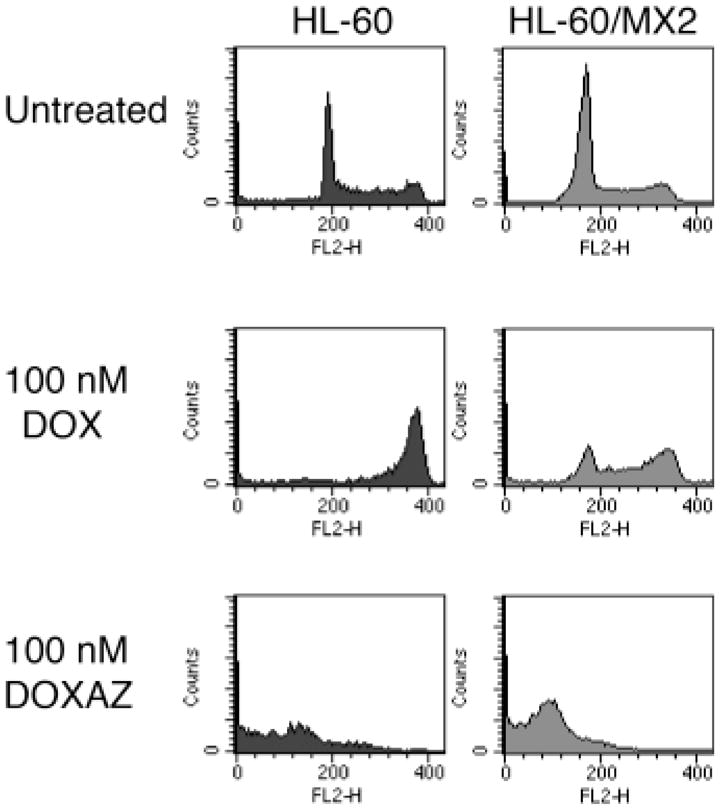
Figure 3.

Cell cycle distribution analyses of HL-60 and HL-60/MX2 cells as a function of exposure to doxorubicin or doxazolidine. HL-60 and HL-60/MX2 cells were treated with 100 nM doxorubicin (DOX), doxazolidine (DOXAZ) or vehicle for 24 h and analyzed for cell cycle distribution. Cells lines are defined in the legend to Figure 2.
