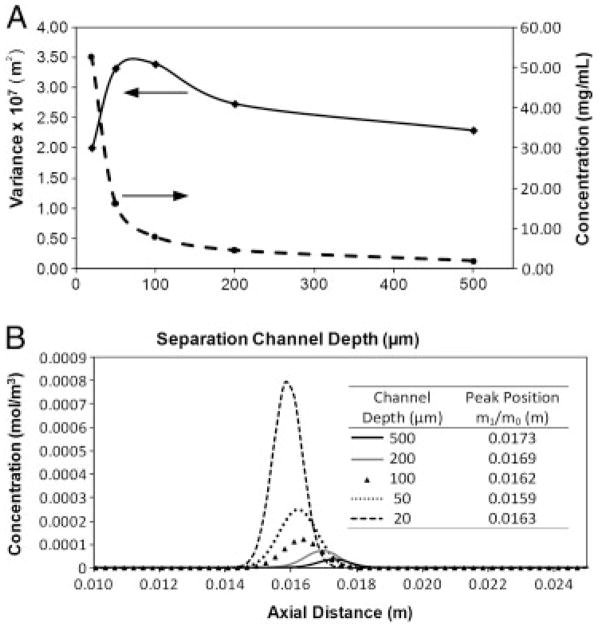
Figure 5.
Moment analysis results. (A) Simulation results showing the effect of separation channel thickness on the average peak concentration and on the peak variance. At thinner separation channel thicknesses higher concentration peaks with smaller variance are achieved. A maximum in the peak variance is obtained in channels with a thickness of about 100 μm. (B) Simulated peak profiles calculated at a distance of 1 μm above the surface of the separation channel. At thinner channels, higher concentration peaks can be obtained for the same protein load.

