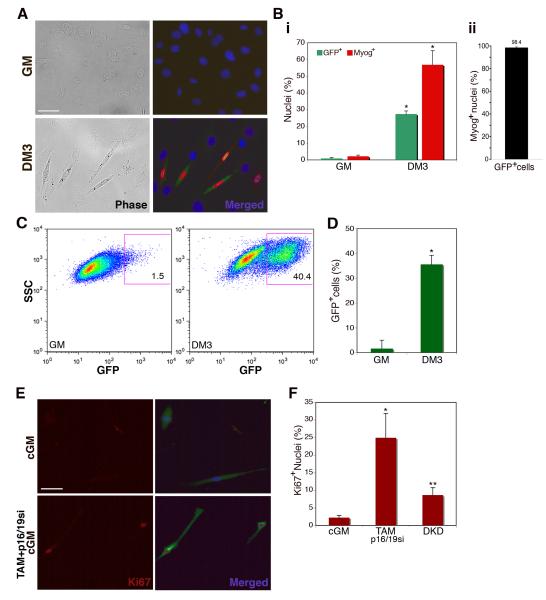
Figure 4. Myogenin-expressing myocytes enter S-phase only after loss of Rb and ink4a gene products.
(A) Immunofluorescence images of myoblasts (GM) and myocytes (DM3) infected with pLE-myog3R-GFP. Cells were labeled with primary antibodies for GFP (green), myogenin (red) and Hoechst 33258 (blue). Bar 50μm. (B.) (i) Histogram represents percentage of GFP-positive (green bars) and myogenin-positive (red bars) cells in growth medium (GM) or differentiation medium (DM3). A minimum of 1000 nuclei were counted from random fields for each trial. Error bars indicate the mean ± SE of at least three independent experiments. (*P<0.005). (ii) Histogram represents percentage of GFP-positive cells that also express detectable myogenin by immunostaining. Individual cells were evaluated for expression of each marker. A minimum of 250 cells were counted from random fields. Error bars indicate the mean ± SE of three independent experiments. (C) Representative FACS plots of myoblasts (GM) and myocytes (DM3) infected with retroviral pLE-myog3R-GFP construct. Gated population indicates GFP-positive myocyte population employed in subsequent experiments. (D) Histogram representation of GFP expression in three independent experimental FACS profiles on myoblasts (GM) and myocytes (DM3) (*P<0.001). (E) Immunofluorescence images of GFP-positive FACS-sorted myocytes cultured in conditioned GM only (cGM) or in cGM with TAM and p16/19si-RNA. Cells were labeled for Ki67 (red) and GFP (green) as well as Hoechst 33258 (blue). Bar 50μm. (F) Histogram represents percent of Ki67-positive nuclei in GFP-positive FACS sorted population, in cGM, treated with TAM and p16/19si, or treated with Rbsi and p16/19si-RNA in tandem (DKD). Growth medium (GM); A minimum of 100 nuclei were counted from random fields for each trial. Error bars indicate the mean ± SE of three independent experiments. (*P<0.01, **P<0.005).

