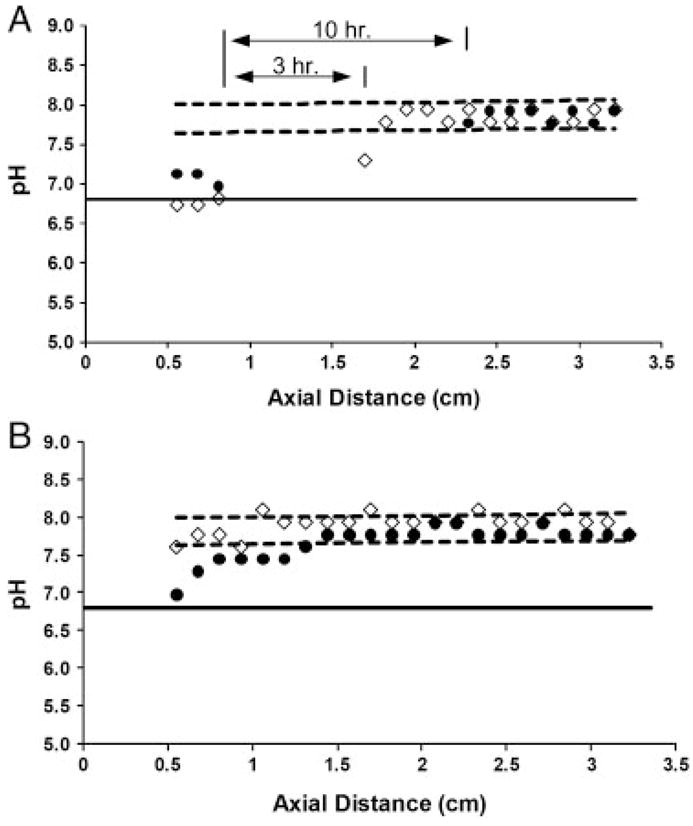
Figure 2.

(A) Measured pH profile along the separation channel for 25 mM Tris acetate buffer at 3 h (diamonds) and 10 h (circles). The region between the 3 and 10 h lines indicates where the pH dropped below the indicating range for neutral red. As a result, pH values in these regions could not be measured with any accuracy. The dashed lines indicate 95% confidence intervals based on our ability to accurately measure pH 8.0. (B) Experimentally measured pH profile for 100 mM bis-Tris EACA at pH 8.0 at 3 h (diamonds) and 10 h (circles). The dashed lines represent 95% confidence intervals.
