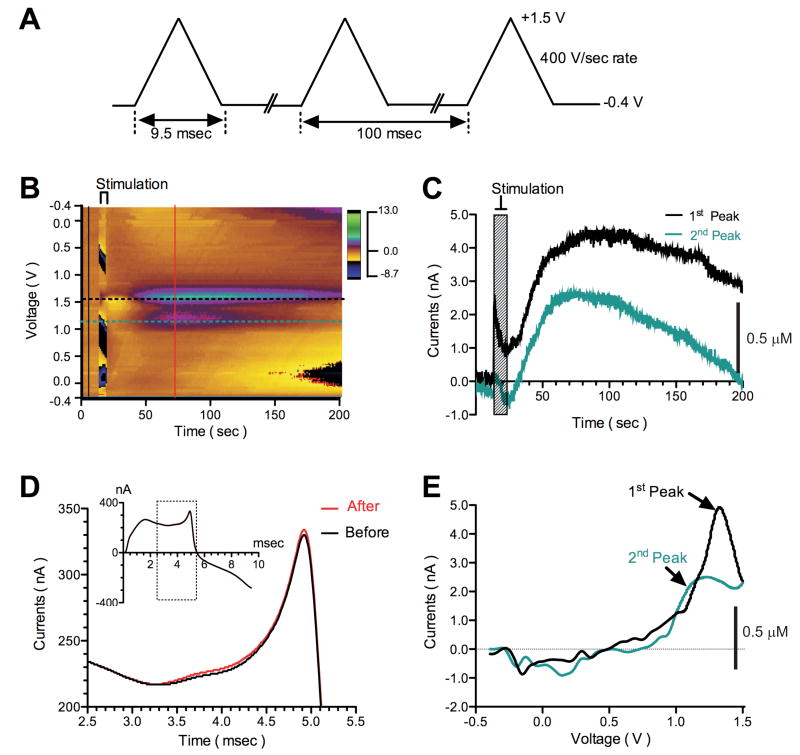
Figure 3.
HFS induces adenosine efflux in the in vitro ferret thalamic slice. (A) Voltage waveform for measuring adenosine. (B) The pseudo-color plot shows adenosine efflux by HFS (125Hz, 200μA, for 5s, 100μs pulse width), detected with WINCS-based FSCV at a CFM. The axes and color gradient indicate the time, the potential waveform applied at the CFM, and the currents detected from the CFM, respectively. Adenosine exhibits unique voltammetric oxidation peaks; the green oval surrounded by the purple ring (at approximately +1.5V) and the purple oval (at approximately +1.0V) represent the 1st and 2nd oxidation peaks of adenosine, respectively. (C) Black and green dotted horizontal lines in (B) indicate 1st and 2nd adenosine oxidation peak currents versus time. This current-time plot clearly shows adenosine efflux induced by HFS. (D) Black and red solid vertical lines in (B) refer to the relationship between background charging currents (before and after HFS, respectively) and applied voltages. A large background current is present at the CFM (Black solid line, see also inset). HFS increased this background current only slightly (red solid line, see also inset). Black-lined box indicates the source of the data shown in the expanded area. (E) A cyclic-voltammogram was obtained by background subtraction (subtracted black line-indicated currents from red line-indicated currents in (D)). A representative cyclic voltammogram shows the 1st and 2nd oxidation peaks at +1.5 and +1.0V, respectively. The green line indicates the differential oxidation peak obtained by forward-going potential from -0.4 to +1.5V, and black line by reverse-going potential from +1.5 to -0.4V.

