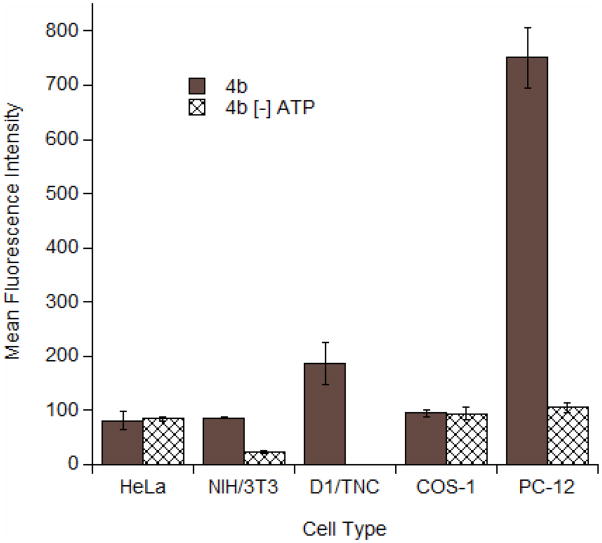
Figure 5.
Flow cytometry analysis of peptide 4b incubated with various cells at 1 μM for 2h. Cells were incubated at either 37°C or under conditions of ATP depletion. After incubation, cells were trypsinized for 15 min to remove membrane-bound peptide. Each bar represents the geometric mean fluorescence of 10,000 cells. Experiments performed in triplicate with the results expressed as the mean fluorescence intensity ± standard deviation.

