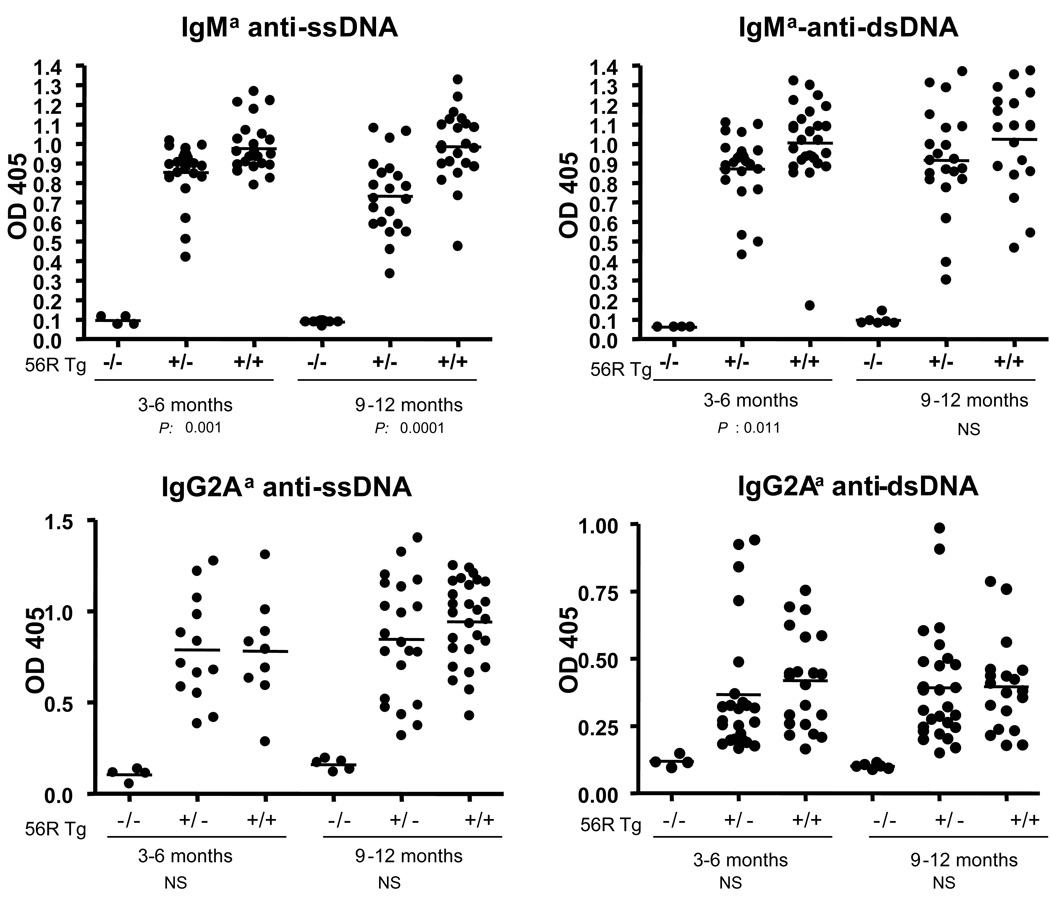
Figure 1. Serum levels of IgM and IgG Abs to nuclear antigens in B6.56R/+ and B6.56R/56R Tg mice.
Allotype-specific IgM and IgG Abs to ssDNA, dsDNA were measured by ELISA. Both 56R homozygous and hemizygous Tg male and female mice (pooled) were analyzed at the ages of 3–6 mo and 9–12 mo. Each dot represents a single mouse. The horizontal lines represent the mean levels of serum autoantibodies in each group of mice. The indicated P values represent the result of a Student’s t-test comparison of B.56R/56R versus B6.56R/+ mice. OD405 readings for the positive control sera ranged from 1.2–1.5. NS = not significant

