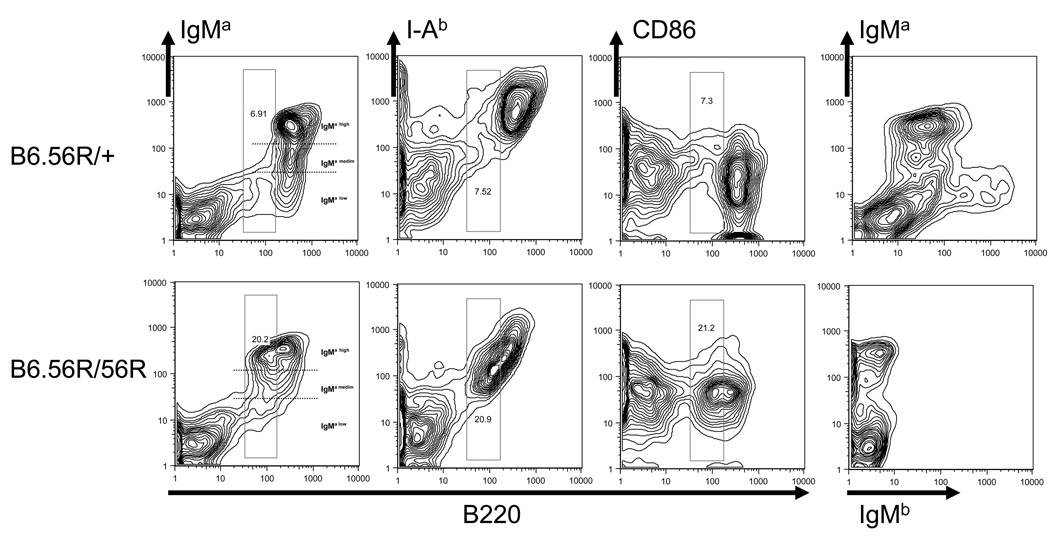
Figure 2. Splenic B-cell phenotypes in B6.56R/+ and B6.56R/56R Tg mice.
Splenocytes from 9–12 mo old B6.56R/+ (TOP) and B6.56R/56R mice (BOTTOM) were analyzed by flow cytometry for the expression of B220 vs IgMa, IgMb, CD86 and I-Ab, respectively. IgMa B-cells were further divided arbitrarily into three groups as demarcated by the dotted lines: IgMa-high B-cells, IgMa-medium B-cells and IgMa-low B-cells; the frequencies of B-cells with different surface IgMa levels are summarized in Table 1. The boxes drawn indicate the expanded population of B-cells in B6.56R/56R Tg mice that were B220int, I-Abint, CD86hi, relative to the B6.56R/+ controls. The profiles shown are representative of data obtained from 8 mice per stain.

