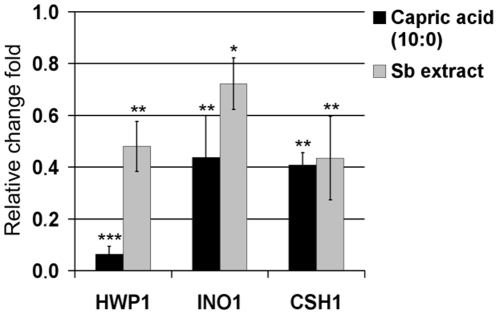
Figure 6. Relative expression of 3 mRNAs of C. albicans cells treated with 45.3 µg/ml of capric acid (C10:0) and 160 µg/ml of S. boulardii extract.
Statistical analysis was performed using one sample Student t-test. P values<0.05 were considered significant. Single stars denote 0.01<P<0.05, double stars 0.001<P<0.01, triple stars P<0.001.

