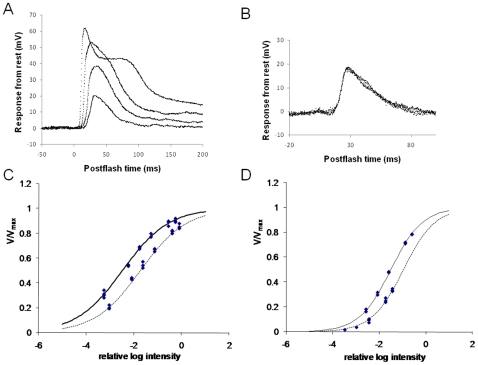
Figure 1. Intracellular recording of photoreceptor responses.
A. Superimposed responses of green photoreceptor to 10 ms flashes (onset at time 0) at 550 nm increasing in intensity over approximately 3 log units. B. Superimposed responses from same photoreceptor to flashes at 500 nm (−3.3 log units) and 620 nm (−2.2 log units). C. V/log I function for a green photoreceptor plotted from responses to 10 ms flashes of varying intensity at 500 and 600 nm. Curves are fits of equation 1 to the data at 500 nm (solid) and 600 nm (dashed). D. Similar data for a blue photoreceptor at 450 nm (solid curve) and 360 nm (dashed curve).

