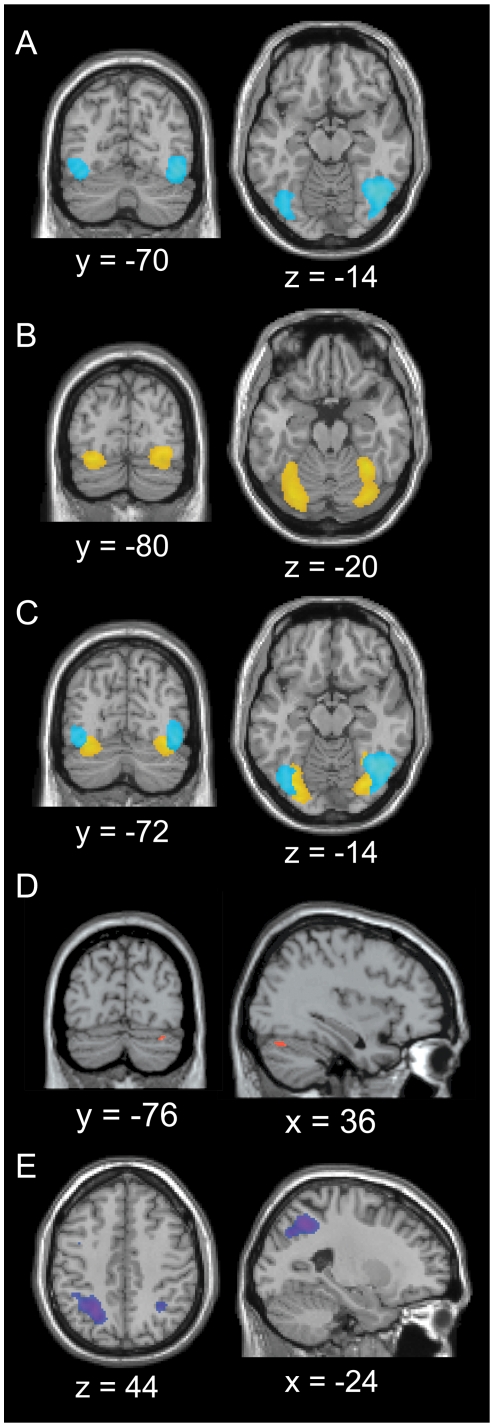
Figure 1. Localising graphemes, colour, and synaesthesia in the brain.
fMRI results of localiser Experiment 1. A–C. Coronal (left) and axial (right) slices (N = 38 at whole brain P<.05FWEcorrected, extent threshold 20 voxels). A. Grapheme areas (false fonts > non-inducing graphemes). B. Colour areas (coloured graphemes > non-inducing graphemes). C. Grapheme (blue) and colour areas (yellow) overlaid. D–E. Effects of synaesthesia, showing positive interactions for synaesthetes (N = 19 synaesthetes, N = 19 controls), at whole brain P<.001uncorrected, extent threshold 20 voxels. D. Synaesthesia > non-inducing graphemes (red), axial (left) and sagittal (right) slices showing right fusiform gyrus activation. E. Synaesthesia > coloured graphemes (blue-purple), axial (left) and sagittal (right) slices, showing left superior parietal lobe activation. Left is depicted on the left.

