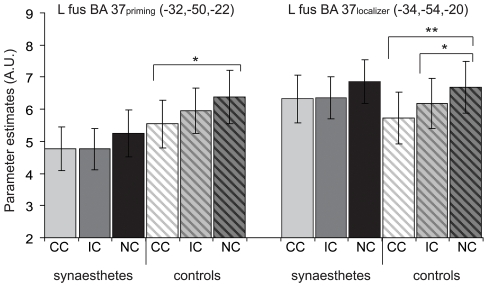
Figure 4. Region of interest analysis of repetition suppression effects for synaesthetic priming.
The mean parameter estimates for ROIs in left anterior fusiform gyrus are plotted for synaesthetes (N = 19, solid bars) and controls (N = 19, shaded bars). Error bars depict ± the standard error of the mean and * (P<.05) and ** (P<.001) denote significant differences between conditions. CC = congruent synaesthetic colour condition, IC = incongruent synaesthetic colour condition, NC = non-inducing condition, L = left, fus = fusiform gyrus.

