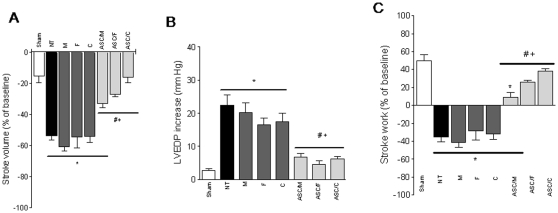
Figure 4. Cardiac response to afterload stress.
Bars represent repercussions induced by phenylephrine injection, expressed as % of change from baseline (except for LVEDP, expressed as mm Hg elevation over baseline), on the stroke volume, LV end-diastolic pressure (LVEDP) and stroke work of Sham (n = 7), NT (n = 8), M (n = 5), F (n = 6), C (n = 6), ASC/M (n = 5), ASC/F (n = 7), and ASC/C (n = 6) groups. Positive or negative values resulted from increase or decrease on the evaluated parameter, respectively. *, P<0.05 vs. Sham; #, P<0.05 vs. NT; +, P<0.05 vs. respective vehicle control.

