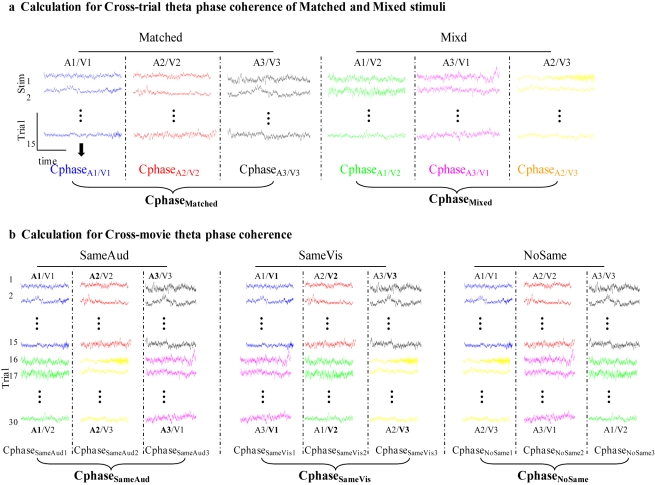
Figure 1. Schematic illustrating experimental design and phase coherence analysis (for a single MEG channel).
The colors represent single-trial responses to each of the six audiovisual streams. The coherence analyses are performed on each of the 157 MEG channels separately. (a) The cross-trial phase coherence is calculated on all 15 trials of the same stimulus condition (same color) and compared to a mixture of trials (see Methods) to get the phase-based and power-based movie discrimination ability (see Figure 2ab). (b) Cross-movie phase coherence is calculated by combining response trials across two movie stimuli (two different colors in each column), where one dimension is matched in auditory (SameAud), visual (SameVis), or neither modality input (NoSame). See more equation details in Methods.

