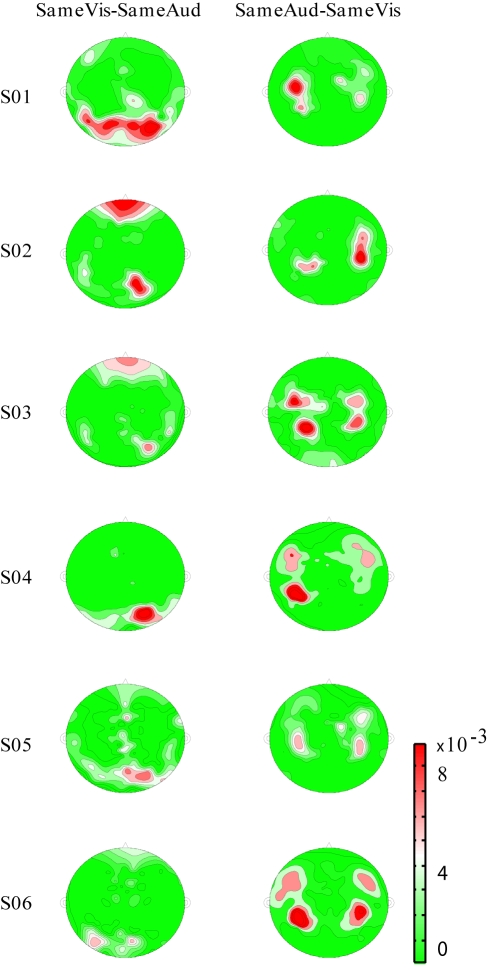
Figure 4. Low-frequency cross-movie phase coherence distribution map.
Delta-theta cross-movie phase coherence distribution map for each of the six subjects, indicating within-modality tracking. In this flat map of the MEG recordings, left is left, right is right, and red indicates larger cross-movie phase coherence. Left: distribution map for larger cross-movie delta-theta phase response coherence of SameVis movie pair versus SameAud movie pair. The comparison implicates occipital (visual) cortex. Right: distribution map for larger cross-movie delta-theta phase coherence of SameAud movie pair versus SameVis movie pair. This analysis shows auditory activation.

