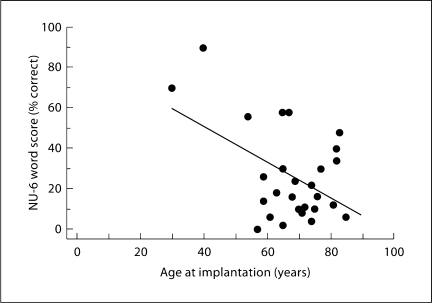
Fig. 2.
NU-6 word score plotted as a function of the age at implantation with a linear regression line. While the linear model accounts for 24% of the performance variance (p = 0.01), it can be seen from the plot that the significant correlation is mainly the result of the 2 subjects (16 and 19) with age at implantation younger than 50. When these 2 subjects are removed, the age at implantation no longer accounts for a significant fraction of the across-subject performance variance (r2 < 0.001, p = 0.94).

