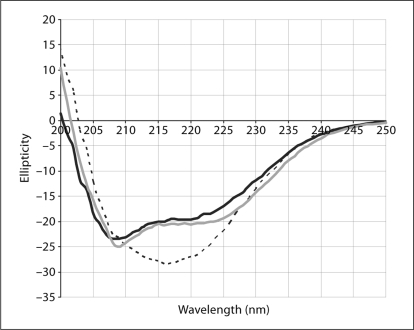
Fig. 3.
Far-UV CD spectra of the VDAC1 protein in the ‘mode A’ reaction where VDAC1 was expressed as a precipitate and subsequently solubilized with Fos-choline detergents. The spectrum of VDAC1 ‘mode A’ (black solid line) is similar to that of SDS/denatured spec previously reported [Shao et al., 1996], and is similar to those of a high alpha-helical content protein such as LAPTM4A (control, grey solid line). In contrast, a CD spectrum of VDAC1 in ‘mode B’ (black dotted line) shows high beta-sheet content, indicating proper folding.

