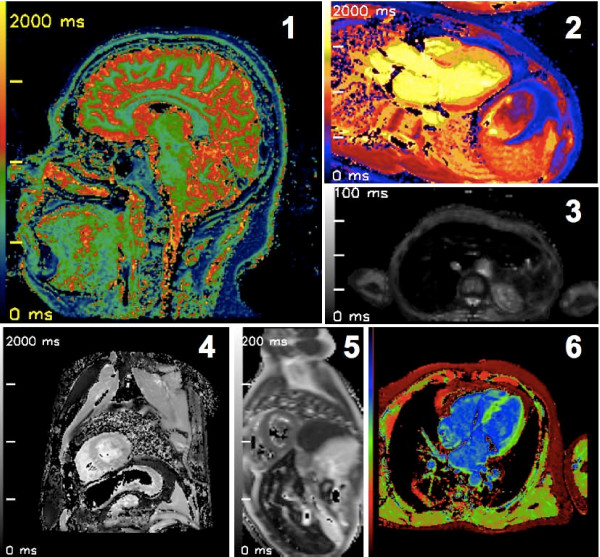
Figure 3.
Relaxation time maps created with MRmap from various sorts of source data. 1) Inversion recovery T1 map; sagittal view of healthy human brain; GE 1.5 Tesla CV/i. 2) MOLLI T1 map; 3-chamber view of acute anteroseptal myocardial infarction; Siemens 1.5 Tesla Sonata. 3) Multi-echo T2* map; axial view of human liver with severe iron overload; Siemens 1.5 Tesla Avanto. 4) MOLLI T1 map; short-axis view of normal human heart; Philips 3 Tesla Intera. 5) Multi-echo T2 map; short-axis view of normal human heart; Siemens 1.5 Tesla Sonata (raw images courtesy of Dr. Taigang He, Imperial College, London, UK). 6) MOLLI T1 map; 4-chamber view; normal human heart; Philips 1.5 Tesla Intera.

