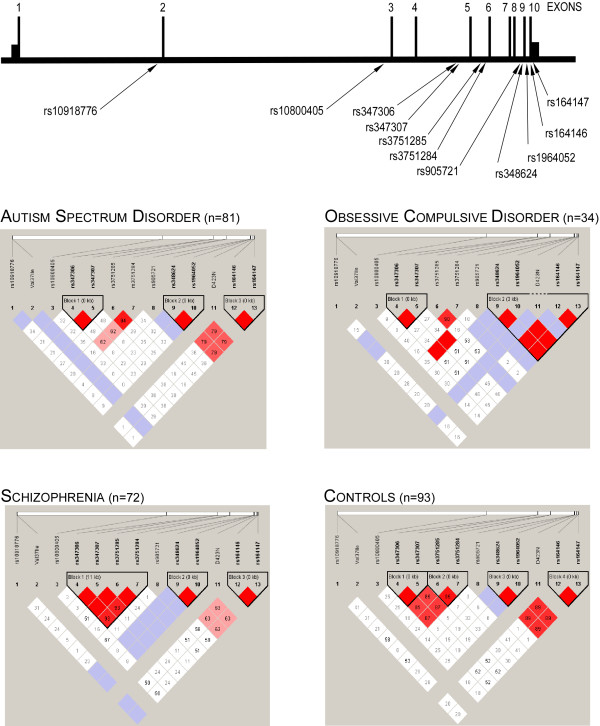
Figure 3.
Schematic representation of NOS1AP with location of frequent single nucleotide polymorphisms and Haploview-generated linkage disequilibrium map of the NOS1AP. Region of high LD (D' = 1) are shown in bright red. Only ASD, OCD, schizophrenic and control subjets patients are shown in the LD diagram. The numbers in the squares are D prime values (×100).

